
.svg)
Key takeaways
What is a bias? and, how does an algorithmic bias in fashion occur?
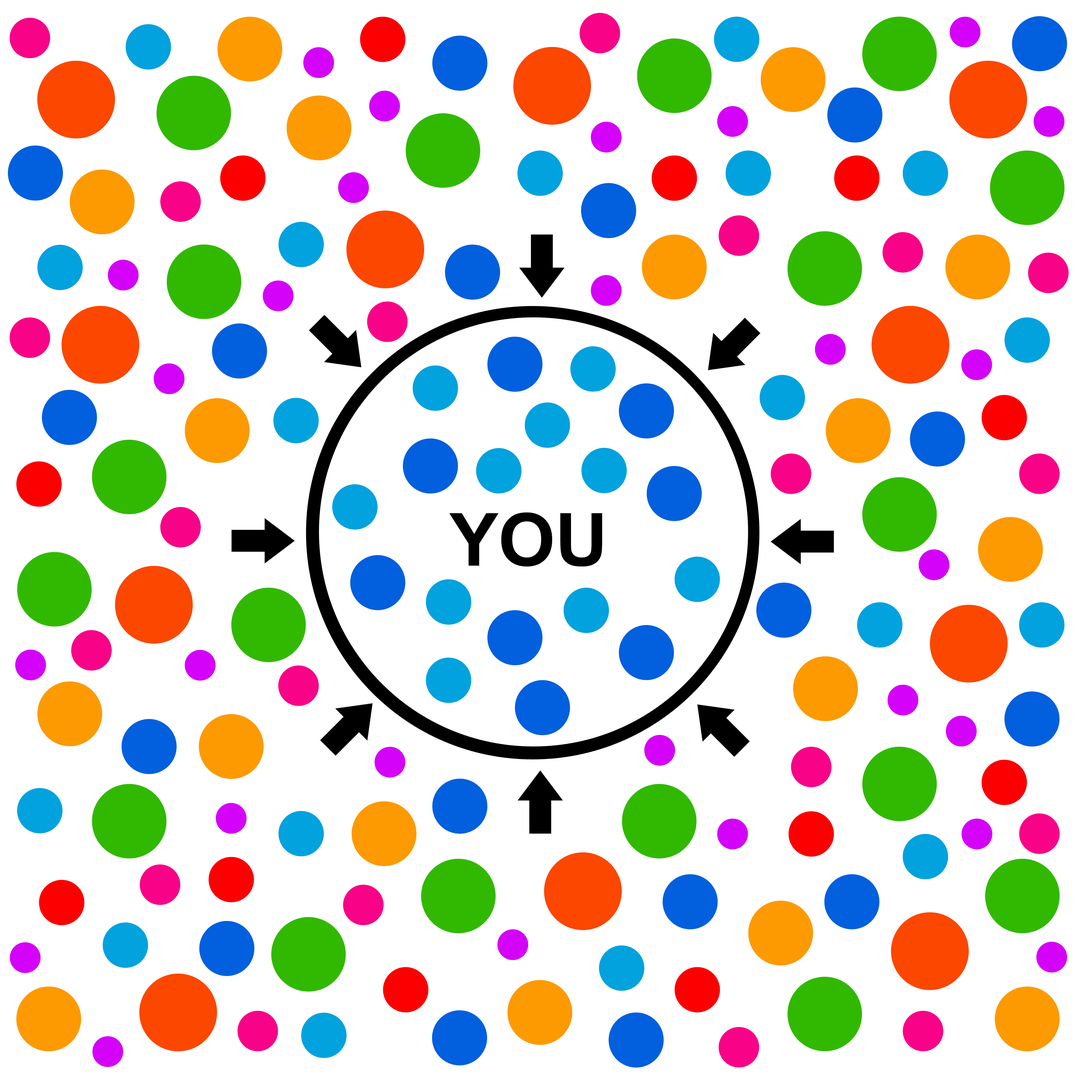
Inclination or prejudice for or against one person or group, especially in a way considered to be unfair.
Recognizing your unconscious bias by David Marshal
We earlier wrote an article on bias in trend forecast. This article addressed the inherent biases that get into trend forecasts.
Biases Are Double Edged Swords
Many times, our human mind uses prejudice to gain speed. For example, when a sharp moving object comes towards us, we move swiftly. They do help in making thousands of small decisions effortlessly.
The use of prejudice in decision making is unfair when it disregards some facts that may advocate another decision.
Do we need to take such swift decisions in fashion and carry the human bias or algorithmic bias in fashion?
What is an Algorithmic bias?
Algorithms are mathematical equations or logical rules or algorithms generated by data (machine learning) to solve a problem. Just like the brain takes swift decisions, algorithms help us in quick decision making.
Algorithms help us to predict an unknown. In other words, they help us to minimise uncertainty. For examples algorithms predict the weather, our credit score, time to reach destination etc. They estimate the probability of an event occurring.
Algorithms are deployed in situations where there is imperfect information. Therefore, algorithms can make mistakes. When the result of an algorithm systematically deviates from the correct answer, there is a bias. For example, when a bank sanctions a loan, the probability of default is 5% on average. If the algorithm predicts 5% and if the same prediction is 2.5% always for a country of origin, there is a bias.
Systematic errors (biases) by humans or algorithms have a serious impact on business performance.
Algorithmic Bias In Fashion Demand Forecasting
There is a rising awareness of using data in fashion demand forecasting.
Data has bias.
Data is related to a context. Context is decisive.
First, consider, for example, you categorized a store as "C" grade and always deprived of that store with selection. This store will carry the bias of the past as the performance data is biased. This is in spite of the data reflecting the reality of sales.
This is a reflection of the "confirmation bias" in past actions and resultant data.
Second, consider taking past sales as a representative of demand. Supply biases sales. Stock biases sales. Hence, there is a need to discover a metric/s that will uncover True Demand You can extend this to many decisions across the fashion value chain. Selection of a product, selection of a vendor, selection of a design, bet on a product, etc.
The famous adage "Garbage In, Garbage Out" is very true. This explains how if bad data gets into the fanciest algorithm, you will end up with a bad outcome.
The various data related biases could be,
a) Subjective qualitative data by humans
b) Data mirroring biased behaviour (eg supply led sales)
c) One-time rare events
d) Conceptual biases created by wrong sampling of data
e) Inappropriate data processing (way it is cleaned, aggregated and transformed)
f) Stability bias - data pertains to a period not representative of the environment
Biases have a "winner take all" cascading effect that percolates through time.
How To Minimise Algorithmic Bias in Fashion?
We want to establish the fact that algorithms on their own are not bias-free. It is important for users of algorithms to ask relevant questions when you are either building yourself or using another partner.
Some of the considerations that you can have to help you minimize the overall bias.
- If an unbiased algorithm is unachievable, the decision process should consider whether to replace the algorithm or combine that with a human decision process.
- Look for competence in your team/partner who could spot potential bias areas in the data. For eg. an article here detailing various ways to minimize data interference.
- Choose the algorithm on relative performance.
- Does the team bring alternate data in enriching the version of the truth in the universe of data used?
Hope this article created a foundation of asking relevant questions and also a construct to assess internal or external stakeholders to minimise algorithmic bias.
At Stylumia, we are committed to deeply work on minimising the overall bias in decision making through,
a) One of its kind Demand Science® to understand dynamic demand of consumers vs the practice of Supply Science which is the traditional method
b) Our True Demand understanding, data processing always keeps the algorithmic bias in mind in determining features, metrics, or engineering them.
Our singular mission is to eliminate guesswork thereby minimizing both economic and environmental wastage in the fashion, sports, home, and lifestyle industry globally.

.jpg)
.jpg)