The Science Of Color Analysis
In 1665, the Bubonic plague raged through Europe, forcing people to their homes and practise “Social distancing”.
Sounds familiar?
However, One young person, in his early twenties who was quarantined in Trinity, turned this period into a “year of wonders”.
The young man referred to is none other than Sir Issac Newton. One of the remarkable things he did in this period was to organize his findings on color in a color wheel which showed the three “primary colors” — red, green, and blue — separated by the three “secondary colors” — yellow, cyan, and magenta.
Newton’s color theory was born, decoding colors in a scientific way for the first time.
Color and Music
Fastrack to the 1800’s, Albert H.Munsell came up with the popular Munsell color order system. He wanted to create an effective and consistent system by which artists can identify the color. This system was to be as orderly and effective as the one used to teach music. So, similar to music—where each note is composed of a particular pitch, intensity, and duration—each color is composed of hue (H), value (V), and chroma (C).
Hue represents the basic color, value represents the lightness or darkness of a given color, and chroma is the brightness or saturation of a given color. HV/C then assigns a numeric notation to each color.
Munsell effectively understood an essentially creative concept scientifically and classified it systematically and made it easy for users. It is interesting to note that while his standardization is still in common use today, we don’t spend time understanding how he came up with the numbering. We simply use organized numbers as references while quoting color.
"One of the most important attributes of fashion is color. There is so much science behind the nomenclature and identification of colors." Share on XThe 21st Century Transformation
Until the 21st century, Color nomenclature and standardisation, underwent transformations only every other century.
Now in 2020, digital media and systems actively use the RGB color system which constructs all the colors from the combination of the Red, Green, and Blue colors. The red, green, and blue use 8 bits each, which have integer values from 0 to 255. This makes for 256*256*256=16777216 possible colors. Most nomenclature today however have only around 1000 or so names. And rightly so, wouldn’t it be a huge task to remember 16777216 names?
In fact, researches show that an average human brain can remember only upto 150 names without being prompted.
So while we can recognise the different tints and shades, it may be difficult to remember a million color names.
Colors-The Stylumia way
Stylumia provides users with a very unique way to extract colors and present their information in a precise and actionable manner.
Stylumia extracts RGB by converting every digital pixel to its color pixel using computer vision, at internet scale.
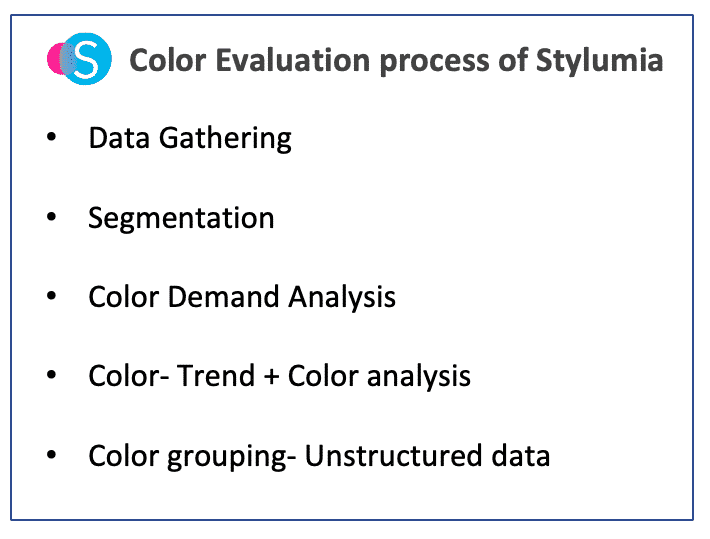
Data Gathering:
From the first instance, all data collected across various sources is at a style-color level as each color performs differently. Each color-way is a separate style to ensure data consistency from day 1.
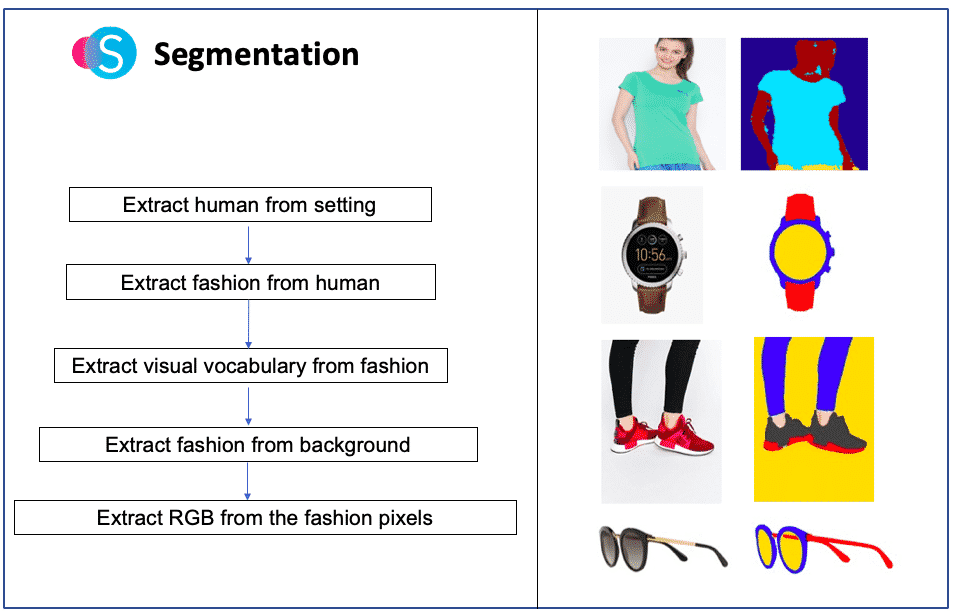
Segmentation:
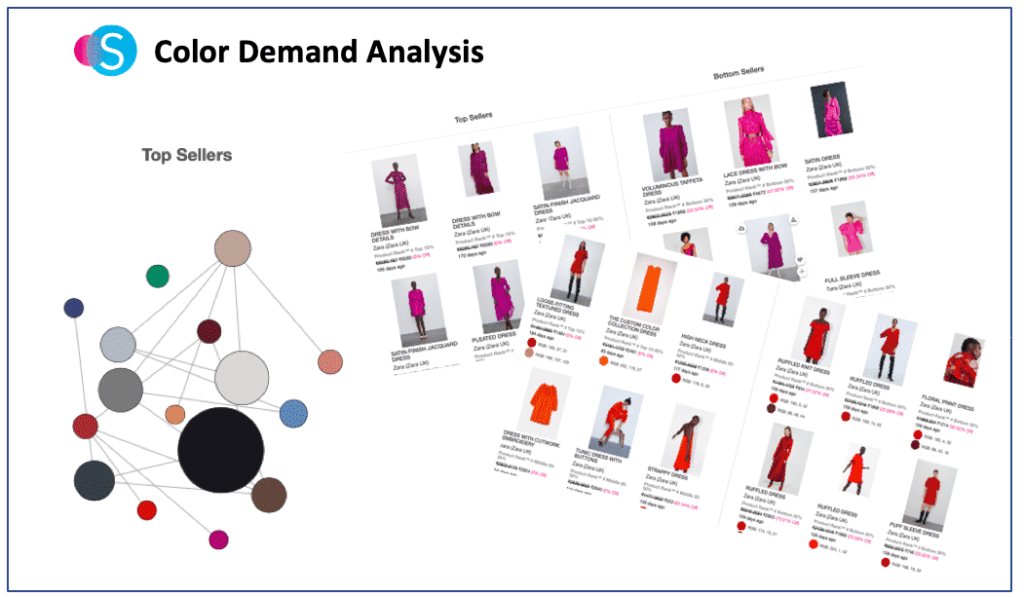
Color Demand Analysis:
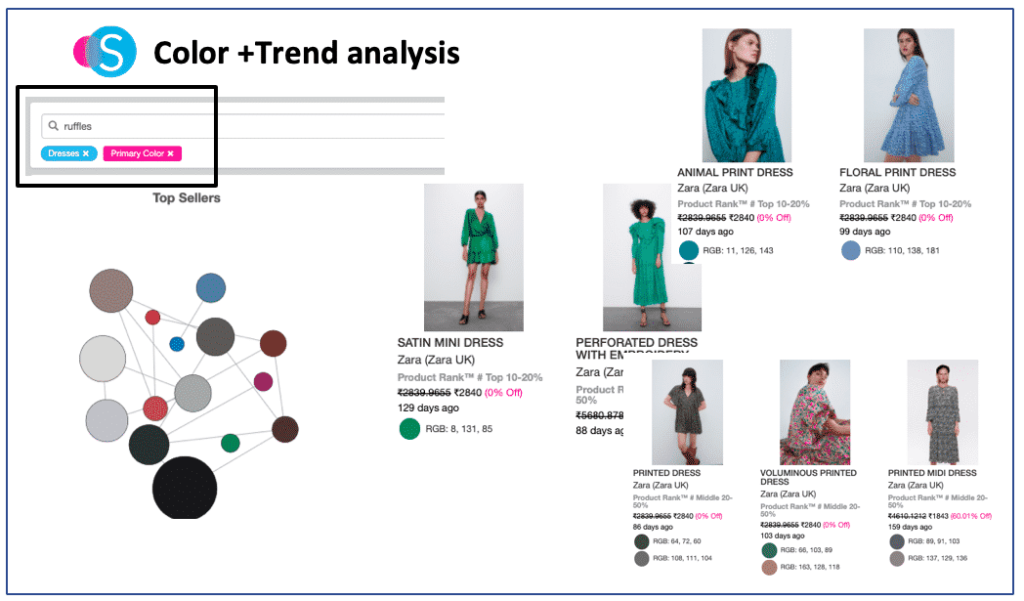
Color- Trend Analysis:
In fact, You can analyse the data in combination to other trends as well. This allows designers to answer questions like ,
” What are the best colorways to make ruffles in?”
” What is the top selling color palette for skinny fits?”
Color Based Clustering of Unstructured Data:
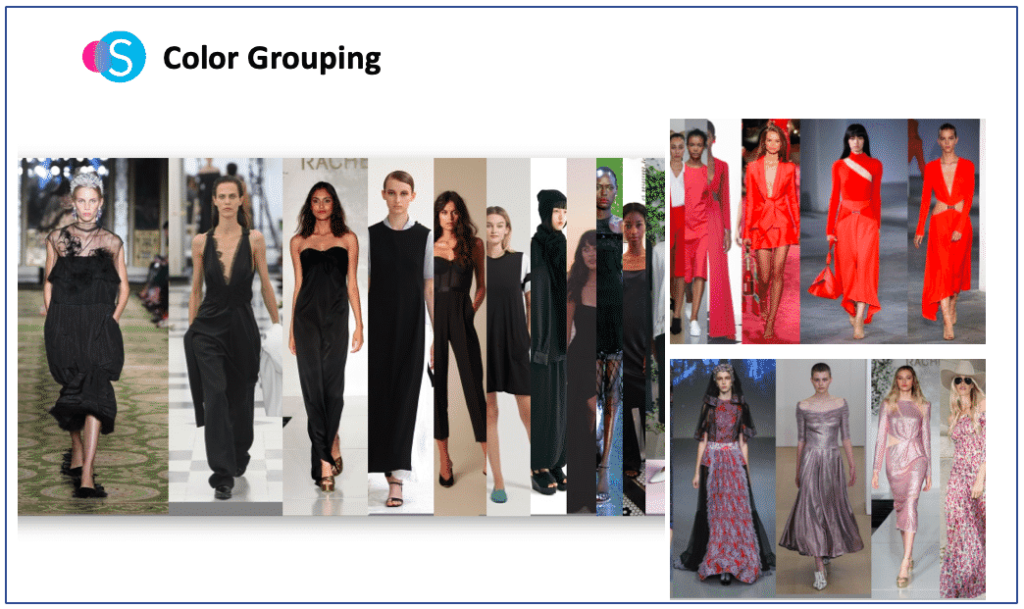
This way of reading colors is also useful in trend research where you have tons of photographs and visuals collected, or, in your past data to understand your own data deeply.
Conclusion:
Colors can make or break the demand for a product. True demand, thus depends on deeply understanding the true color of the product.
"Luckily, today’s technologies are able to mimic human beings' visual senses but at scale ( we are talking millions of images sorted by color in a few hours)." Share on XStylumia is one of its kind solution available today for all fashion and retail businesses to understand winning color ideas without losing information.
To Empower your businesses with this powerful capability, feel free to reach out to us for further information.