.svg)
This edit looks at key Gestalt principles with illustrations.
Why some designs look great and others don’t?
It lies in the psychology of visual perception. What happens when your design creations meet consumers’ eyes? Understanding how a design is perceived at the fundamental level will be a great asset to any creator/design professional. Gestalt psychology (word Gestalt is of German origin meaning “an organized whole that is perceived as more than the sum of its parts” ) is an attempt to understand the laws behind the ability to acquire and maintain meaningful perceptions in an apparently chaotic world (source: Wikipedia).
Once we know the principles, we must be able to generate designs that can create great visual perceptions and thus winning designs.
The idea behind Gestalt principles
When we perceive the world, there are so many signals that come and hit us at once. To avoid going crazy, we perceive them as groups. Understanding how these signals are “grouped together” is what Gestalt principles are all about.
Principle # 1: Similarity
“Items that are similar are grouped together”
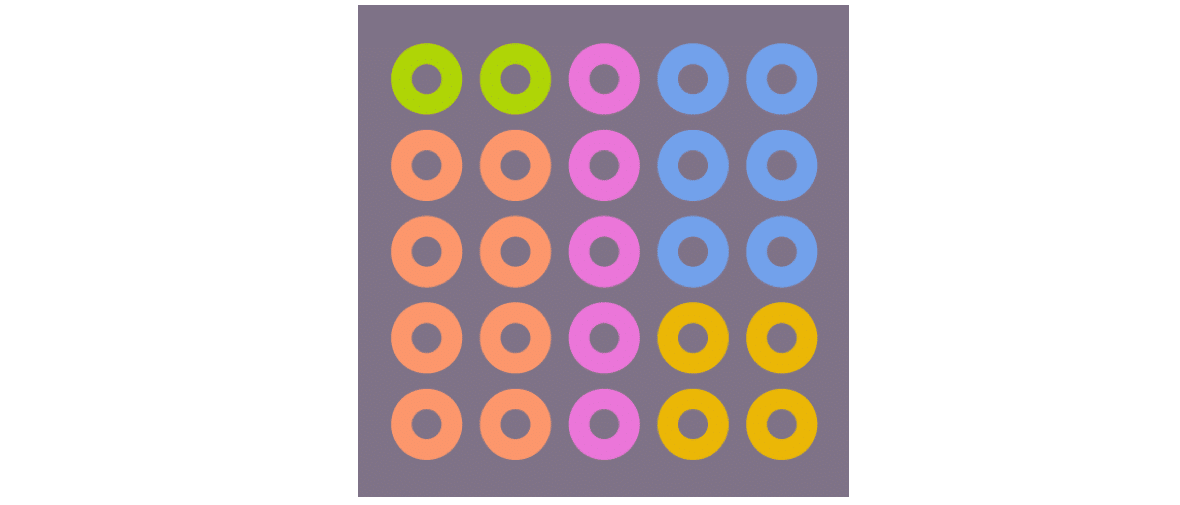
We perceive elements belonging to the same group when they look like each other. They may be similar in any dimension, colour, texture, font, size and orientation. In the image above, colour is the unifier.
Principle # 2: Pragnanz/ Simplicity
“Our mind perceives everything in its simplest form”

The image above is a complex one, but our mind perceives them as a combination of three shapes. When coloured, the three come alive distinctly.
Principle # 3: Proximity
“Objects that are close are grouped together”

There are 25 symbols in this logo and in unity, we perceive U which does not exist otherwise. It is the proximity of these symbols that create the perception.
Principle # 4: Continuity
“Lines are seen as following smoothest path”
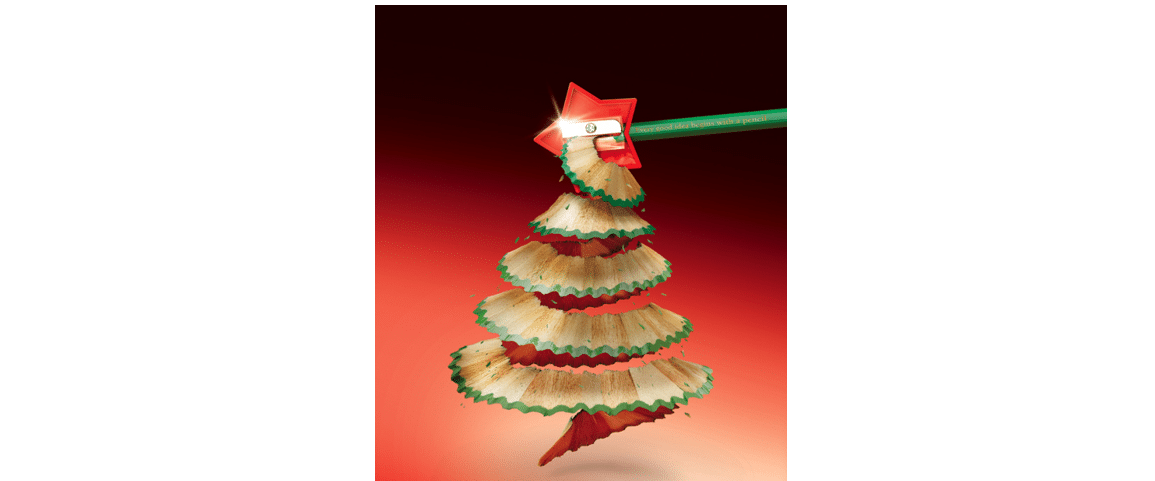
The flow of the green lines from the sharpened pencil gives continuity of the image as if it's a Christmas tree. This visual was used as a Christmas greeting by an agency (Publicis)
Principle # 5: Closure
“Objects grouped together are seen as a whole”

If you have not spotted this hidden arrow before you are not alone. The illusion of continuity is created by the negative space between E and x.
Gestalt principles are universal for visual perception across domains. Fashion is no exception. Stylumia CIT provides real-time availability of consumer blockbusters. One way to read these insights is to look at individual attributes of these products, another way is to look at “what design principle that these designs have which makes them winners”. Getting to understand principles will give you repeatable formula for winning designs.
Illustrated below two products, one is the bestseller and the other is a relatively poor seller. Can you identify which of the design principles the bestseller has and which the poor seller does not have?